yammer – Metrics made easy – Part I
Metrics by yammer provides runtime metrics and statistics for all kind of apps you can imagine. A lot of stuff is directly useable out of the box, for example measuring request/response cycles of webapps and provide histograms of the measured values. So, lets try enabling a simple Java-Application built by maven.
First we add needed dependencies into our pom:
            com.yammer.metrics
            metrics-core
            3.0.0-BETA1
After providing this, we are able to do something like that in our code:
static final MetricRegistry metrics = new MetricRegistry("Demonstration");
The MetricRegistry is not more and not less than a structural component for a couple of Metrics in you Application. Let’s imagine you’ve developed an application for remote number crunching, then it would be a good idea creating 2 MetricRegistry Instances like this:
static final MetricRegistry crunchMetrics = new MetricRegistry("CrunchMeasurement");
static final MetricRegistry requestMetrics = new MetricRegistry("RequestMeasurement");
You would use one of them for all measurement of the crunching component itself and the other for the little server you included to access your numbercruncher (possibly to measure request/response cycles too).
First step is done. We are now able to add some Metrics to a registry which is needed to expose them. But wait … what we should expose now?
Which possibilities do we have with metrics?
Well, there are 5 types of measurements included
- Gauge (instantaneous measurement of one value)
- Histogram (measurement of value variants)
- Timer (measurement of timings)
- Counter (measurement of atomic longs)
- Meter (measurement of ticks in a time range)
as well as some typically needed ones for special purposes like the
com.yammer.metrics.servlet.DefaultWebappMetricsFilter (we will discuss this later in the blog)
So for our example we should take two types of measurements: a Timer for measurement of request/response cycles and a second timer for measurement of the number crunching calculation.
Next step is to expose the measured values to a format you can use it. Metrics provides a lot of default exposements like:
* JMX
* JSON
* CSV
* log4j / slf4j
* logback
* ganglia
* graphite
* console
Of course you are able to create your own Reporters ’cause its open source software 🙂 For our example it’s enough using one of the bundled reporters, e.G. the ConsoleReporter.
So, at a glance we need to do the following steps to enable a Java-Application with Metrics:
1.) Create and instantiate a MetricRegistry (i highly encourage you to inject them into your productive code!)
2.) Create Measurements to your needs (in our example the mentioned 2 timers)
3.) Create and instantiate a Reporter to your needs ( i highly encourage you to inject them into your productive code 🙂
Let’s show this with a very straightforward coded application
	final MetricRegistry metrics = new MetricRegistry("Demonstration");
        evictions = metrics.counter(MetricRegistry.name(HealthCheckDemo.class, "cache-evictions"));
        request = metrics.timer(MetricRegistry.name(ArithmeticDemoOperation.class, "calculation-duration"));
        reporter = ConsoleReporter.forRegistry(metrics).build();
        jmxReporter = JmxReporter.forRegistry(metrics).build();
        reporter.start(1, TimeUnit.MINUTES); // should expose values every minute
        jmxReporter.start();
After running this application you should see a console output like this:
05.05.13 08:22:03 ==============================================================
-- Counters --------------------------------------------------------------------
org.synyx.demos.HealthCheckDemo.cache-evictions
count = 1
-- Timers ----------------------------------------------------------------------
org.synyx.demos.ArithmeticDemoOperation.calculation-duration
count = 1
mean rate = 0,02 calls/second
1-minute rate = 0,09 calls/second
5-minute rate = 0,17 calls/second
15-minute rate = 0,19 calls/second
min = 1250,28 milliseconds
max = 1250,28 milliseconds
mean = 1250,28 milliseconds
stddev = 0,00 milliseconds
median = 1250,28 milliseconds
75% <= 1250,28 milliseconds
95% <= 1250,28 milliseconds
98% <= 1250,28 milliseconds
99% <= 1250,28 milliseconds
99.9% <= 1250,28 milliseconds
05.05.13 08:23:03 ==============================================================
-- Counters --------------------------------------------------------------------
org.synyx.demos.HealthCheckDemo.cache-evictions
count = 1
-- Timers ----------------------------------------------------------------------
org.synyx.demos.ArithmeticDemoOperation.calculation-duration
count = 1
mean rate = 0,01 calls/second
1-minute rate = 0,03 calls/second
5-minute rate = 0,14 calls/second
15-minute rate = 0,18 calls/second
min = 1250,28 milliseconds
max = 1250,28 milliseconds
mean = 1250,28 milliseconds
stddev = 0,00 milliseconds
median = 1250,28 milliseconds
75% <= 1250,28 milliseconds
95% <= 1250,28 milliseconds
98% <= 1250,28 milliseconds
99% <= 1250,28 milliseconds
99.9% <= 1250,28 milliseconds
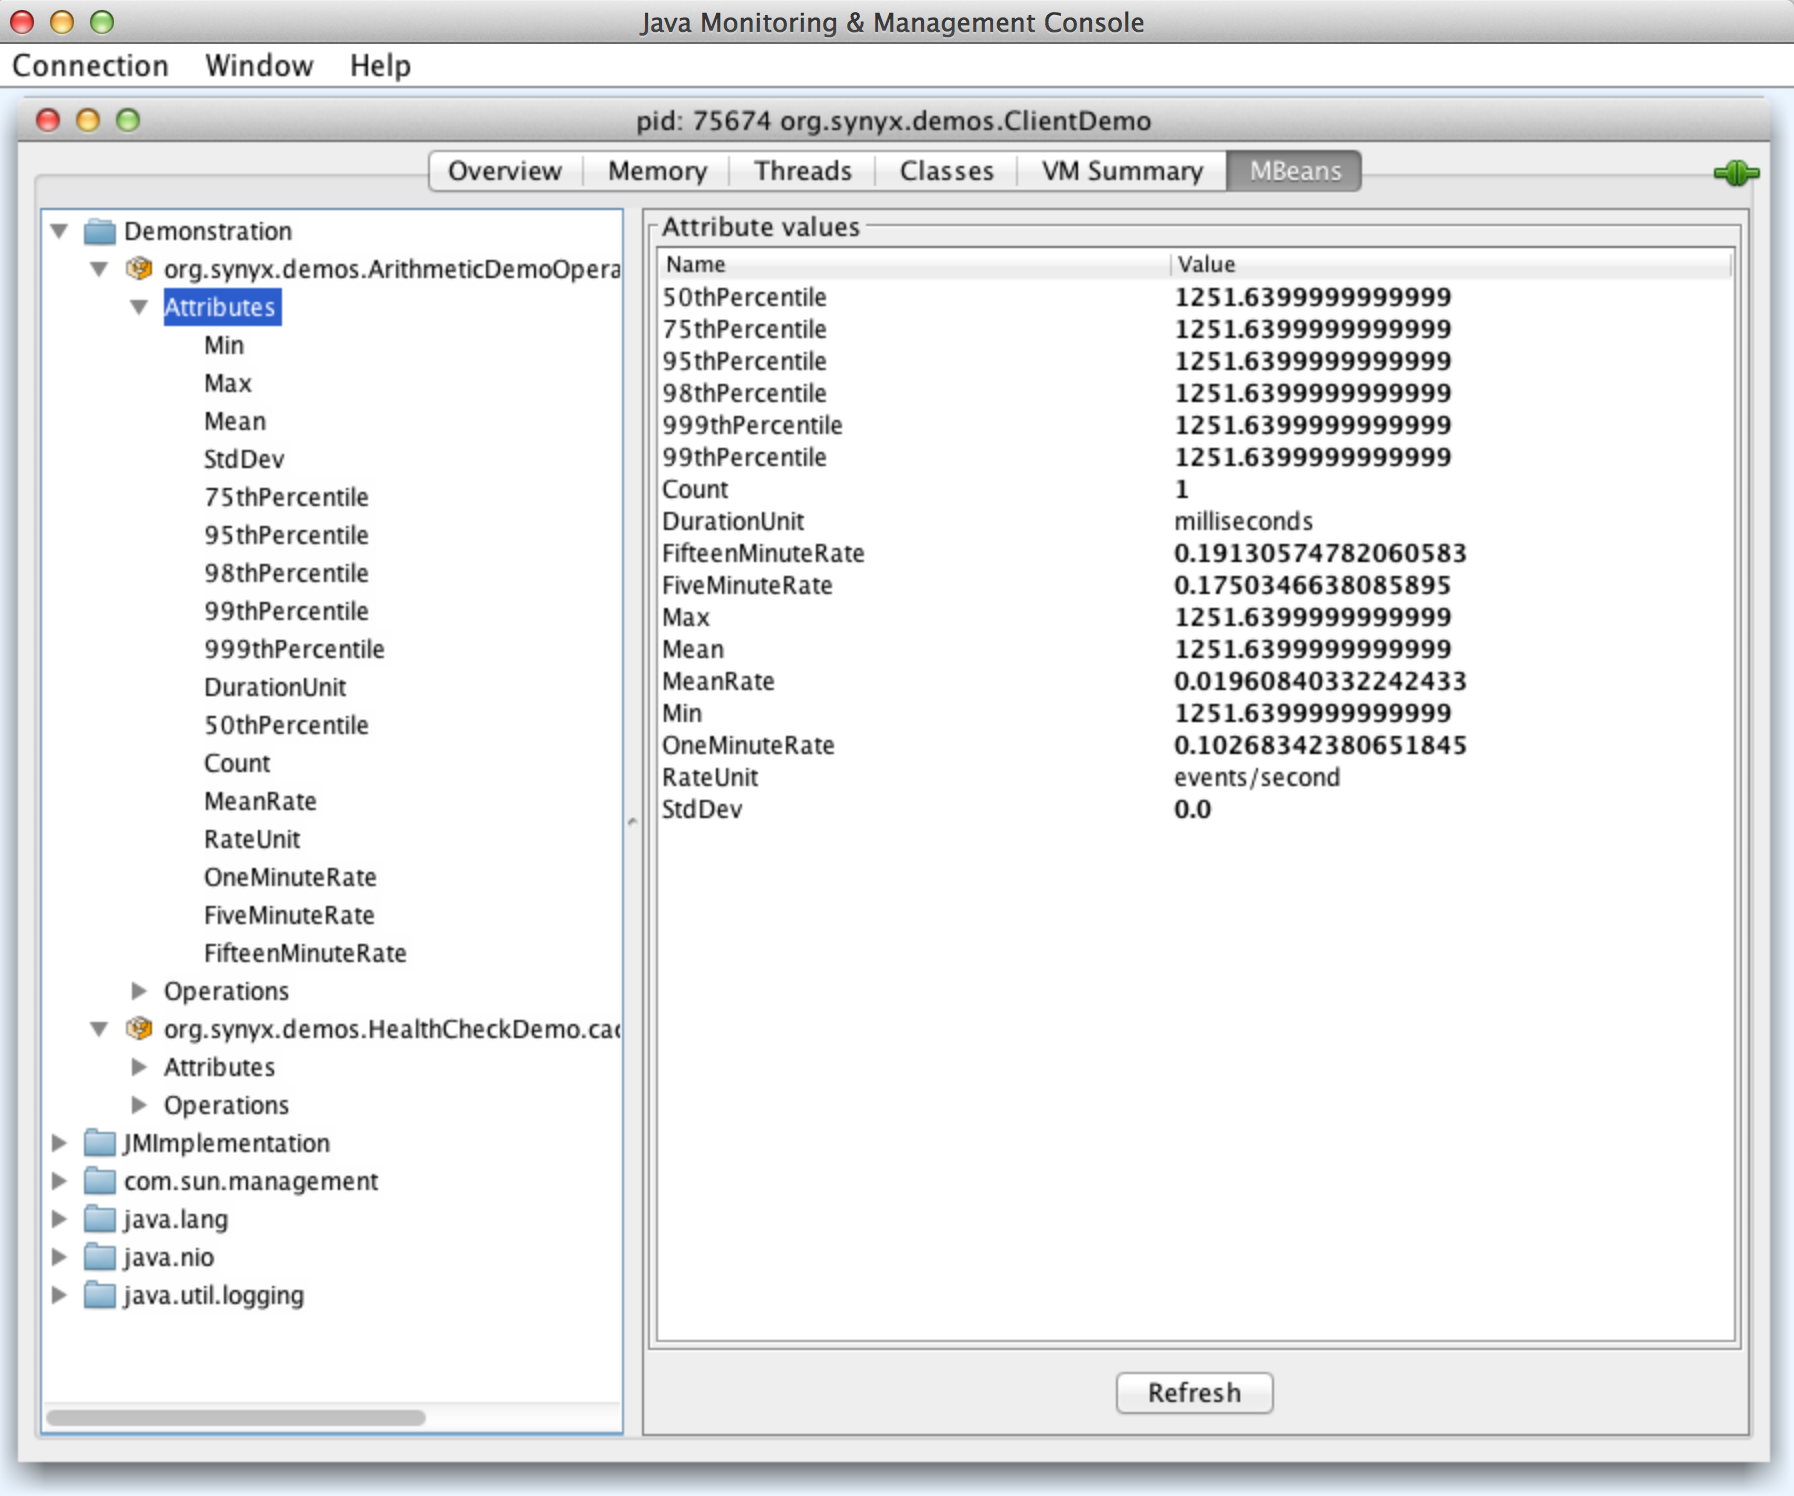
Furthermore, if you debug the demo application you are able to inspect our exposements via a jmx-client like jVisualVM of jConsole after connecting.
SUCCESS!! \o/ As you can see you are able to expose the same values to different reporters if you want to. Isn’t that nice? Yes it is!
Next time we will enable a java-webapplication with some measurements, so stay tuned!
akhil
Hi Joachim , I have a question related to one minute rate count and five minute one. I am facing an issue that these values are exponential like this 4.2741534952513706E-213 which i can not display these numbers in my dashboard. any suggestions on how can i do that parsing with in metrics dropwizard to override these rate count ?
akhil
akh2ny@gmail.com