Java Deep Dive – class file format for debug information
We are developing Apps for Android and one important aspect of our pipeline is automated device testing using Espresso. My co-worker recently had to debug an Android test that would fail on only one of our various devices.
The test claimed that one of the checked Views was not visible (enough), under visual inspection the User Interface looked fine though. To find out exactly why the offending View made Espresso fail, he decided to debug into the ViewMatcher.
We were surprised that no variable values where available when debugging inside Espresso[1]. There was no way for us to read the values of the offending View-object:
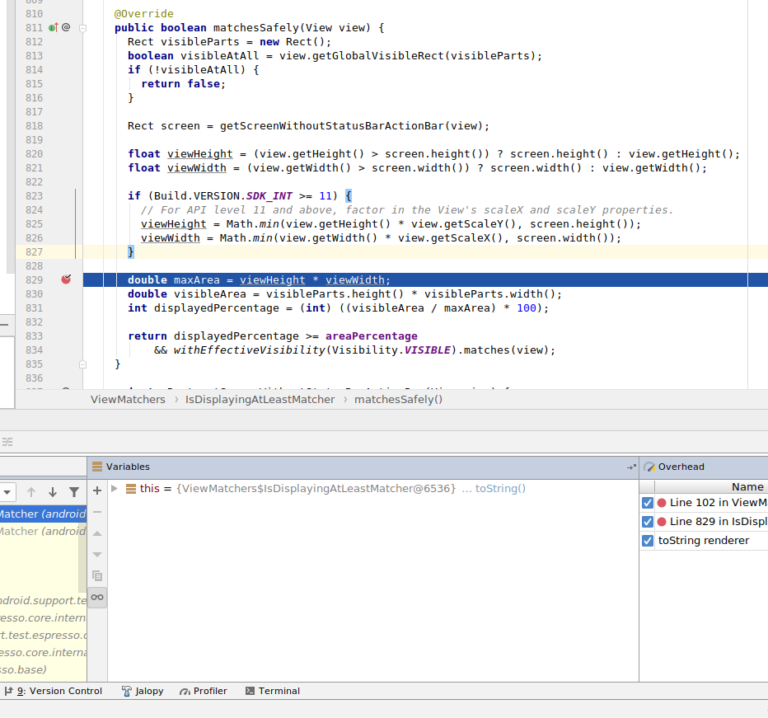
Here we even get the warning Variables are not avaible

Debugging our own code was working as expected, so the IDE and debugger itself seemed to work fine. We suspected that the Espresso library might miss some critical debug information. The test was fixed shortly after, but we were still curious about the behaviour of the debugger and wanted to know if the initial guess was correct.
What exactly is stored in java classes for debugging? How is that information stored? We will find out right here.
Debug information format in Java class files
A class file can contain three different pieces of debug information:
- line information
- local variable information
- source information
This is explained when calling
javac -help
Compiling withjavacjavap
We decided to download[3] the Espresso core library from a maven repository, unzip the Android aar-Archive and finally unzip the contained classes.jar. Running javap -l

Adding the -l option should print line and variable information but we only find LineNumberTable entries.
Using a hex-editor we can verify that the class file seems to contain a LineNumberTable of some kind:

We check one of our own, fully debuggable class files again with javap -l
We can see the LineNumberTable as well as a LocalVariableTable that was missing in the ViewMatchers class.
Assumption & Verification
At this point we can assume:
LocalVariableTable is required to debug variable values
Comparing behaviour and class content between Espresso and our own code we can assume LocalVariableTable is required to debug variable values.
LineNumberTable is required to use breakpoints
Unrelated to the above behaviour: A single line of source code can be translated to many bytecode statements. Placing a breakpoint on a source code line requires a debugger to know which bytecode statement to break at. Therefor, omitting the LineNumberTable should break the ability to set and trigger breakpoints.
We will try to verify both of these assumptions by compiling our own class using javac -g:none
The Android Gradle/Groovy build is sometimes difficult to work with, this is a solution to add arguments to the java compiler [4]
allprojects {
    gradle.projectsEvaluated {
        tasks.withType(JavaCompile) {
            options.compilerArgs << "-g:none"
        }
    }
}
After cleaning & rebuilding our app we restart the test and try to debug:

We can see the breakpoint is disabled! Additionally, after starting the test we fell right through to the next stackframe in ViewMatchers. We did not stop at the breakpoint! Breaking in ViewMatchers and dropping down the stack we can also confirm we there is no local variable information available.
Checking the output of
javap -lagain we can verify the missing debug information:

Final Thoughts
We have seen how the IDEs debug behaviour and capabilities relate to the information embedded in the class files.
This is relevant to Android just as well as “traditional” java applications. Android also relies on the information embedded in the class files, as we have seen when unpacking the Espresso-Core AAR archive. We were able to use basic tools from the JDK (javap) to analyze Espresso classes.
We still don’t know why Espresso is missing the LocalVariableTable. Building our App in the Release-Variant with debuggable=false did still include the full debug information. It is possible that Proguard is responsible for stripping the information from the class files, it seems at least capable [5] to do so. Unfortunately, the documentation for ProGuard is not explaining when and how debug information is manipulated.
For a deeper technical reading of the class file format you can consult the documentation provided by Oracle [6]. Be careful to check the correct java version.
And finally, the next time you debug an application you hopefully have a better understanding of some of the involved parts.
We might possibly explore the remaining open questions in a future blog post.
References
- https://developer.android.com/training/testing/espresso
- https://www.logicbig.com/how-to/java-command/compile-with-debug-info.html
- e.g.: https://mvnrepository.com/artifact/com.android.support.test.espresso/espresso-core/3.0.2
- https://stackoverflow.com/a/42297051
- https://stackoverflow.com/a/5258014
- https://docs.oracle.com/javase/specs/jvms/se8/html/jvms-4.html#jvms-4.7.12